T
oday, We’ll learn how we can know our node app better, and how to detect how much memory our app is consuming. So let’s follow the below steps.
Step 1: Create a basic node.js application:
Let’s create a basic node.js application, create two files with the name app.js and package.json:
package.json
                        {
                            "name": "heap-snapshot",
                            "version": "1.0.0",
                            "private": true,
                            "scripts": {
                                   "start": "node --inspect app.js"
                              },
                            "author": "Shubham Verma",
                            "license": "",
                            "dependencies": {
                                             "express": "^4.14.1",
                                             "fast-levenshtein": "^2.0.6"
                                 }
                            }
app.js:
Step 2: Go to the app location and run below command
npm install
Profiling Node App
Step 3: After the successful installation, run bellow command:
node --inspect app.js
Profiling Node App
Step 4: Be careful at this step, after running the `node — inspect app.js` command you can see an URL start with ‘ws’, just like in above snapshot
ws://127.0.0.1:9229/a1c6b690-d8ef-4da6–9a50–23118d400640Now what you need to do is, you need to make an URL like this
devtools://devtools/bundled/js_app.html?experiments=true&v8only=true&ws=127.0.0.1:9229/a1c6b690-d8ef-4da6–9a50–23118d400640Step 5: Now, open the above URL in the browser, make sure URL is correct, otherwise, you will get the following error:
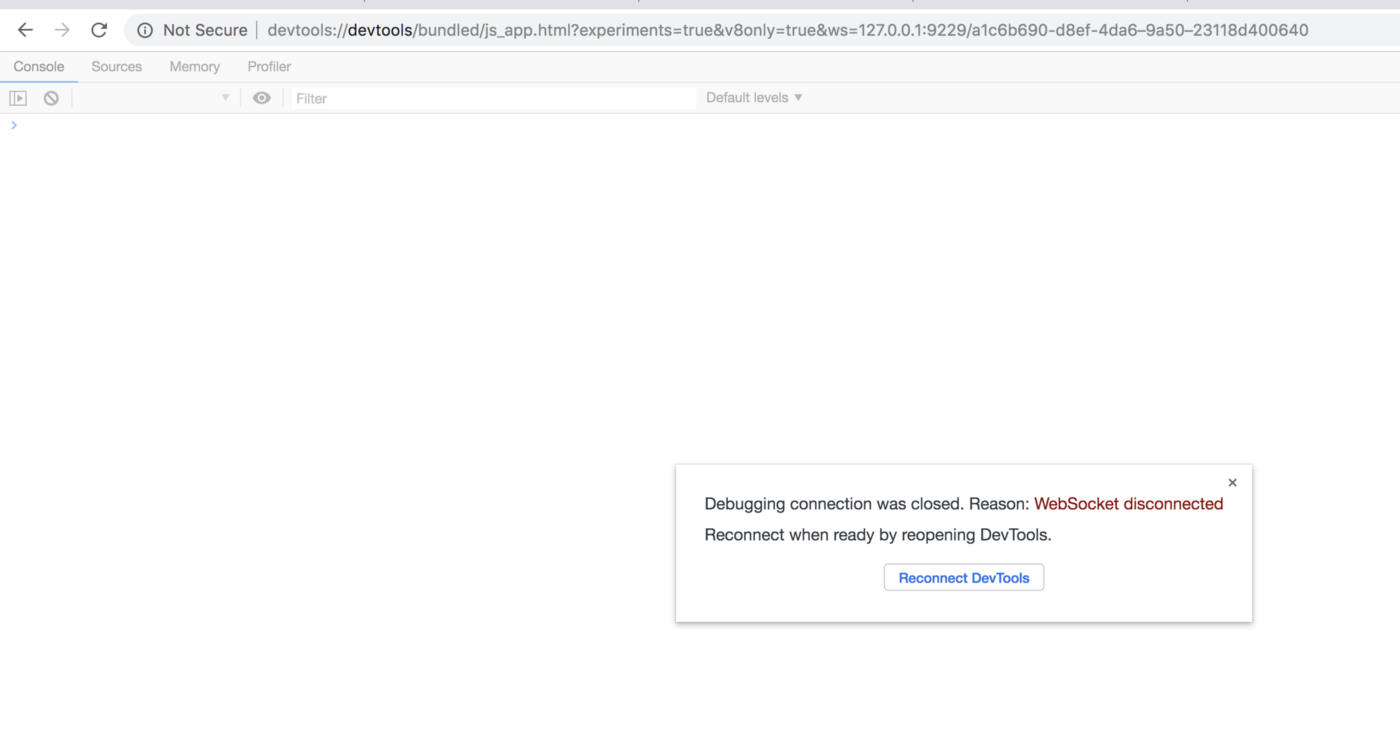
Profiling Node App
( Suggestion: make your URL into browser’s address bar )
If your URL is correct you can see below the page in your browser:

Profiling Node App
Step 6: Click on the link ‘http://localhost:8080/’:
Step 5: Click on the link ‘http://localhost:8080/’, it will open a tab with URL ‘http://localhost:8080/’ ( you can directly open the URL `http://localhost:8080/` into browser )
Step 7: After clicking/opening URL `http://localhost:8080/` you can see the below page, also open network tab in dev tools.
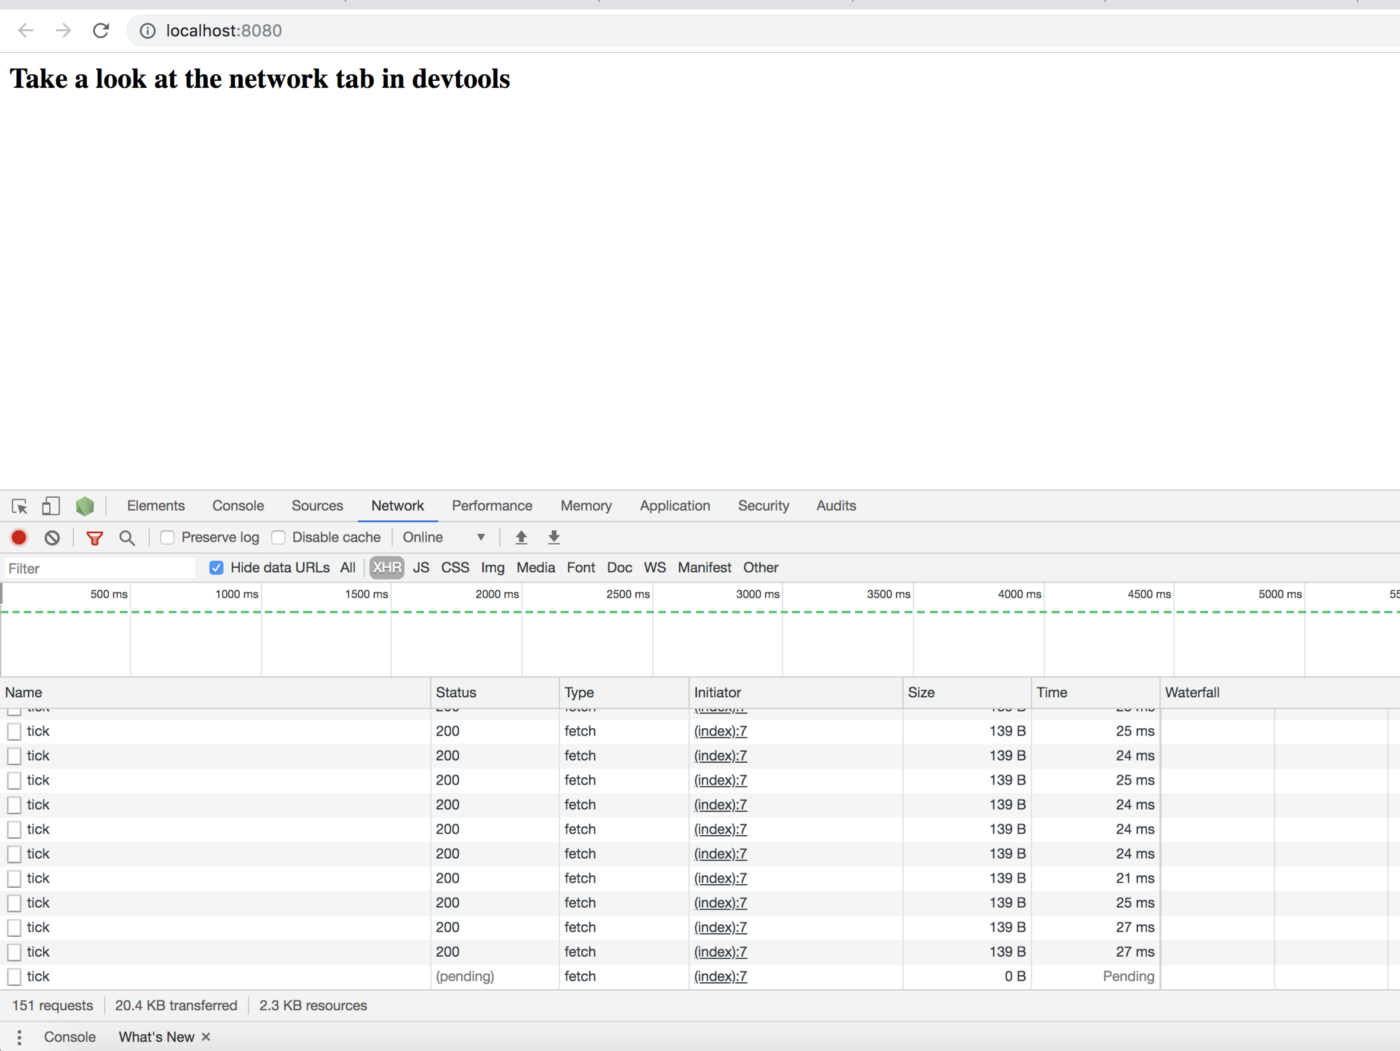
Profiling Node App
You can see there are many requests are hitting by the browser. if not then check all the steps again ( you are doing wrong somewhere ) If yes then move to the next step.
Step 8: Now open the dev tool tab ( which is previously opened in step 4 )
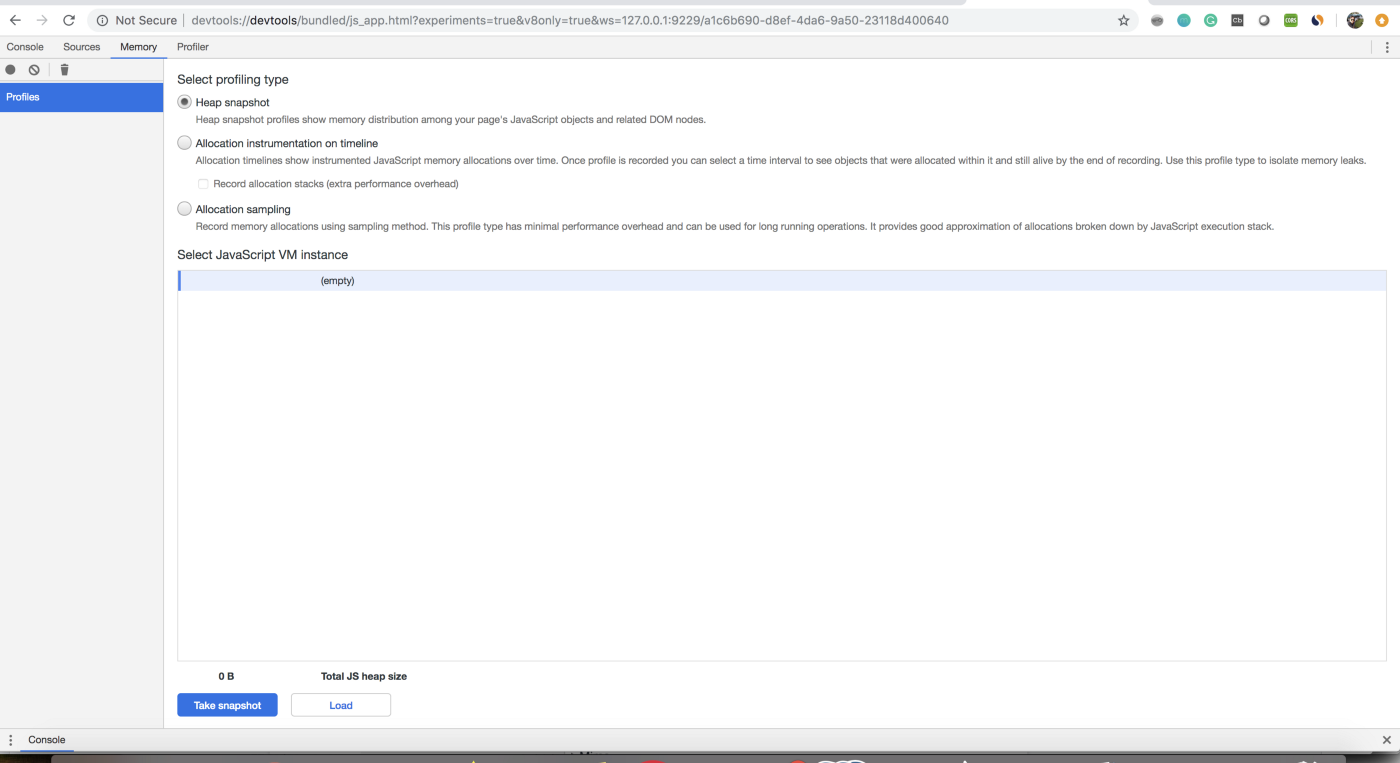
Now open the dev tool tab ( which is previously opened in step 4 ) Click on “Memory”, Select “heap snapshot” under the “select profiling type” and click on the below button “Take snapshot”.
Profiling Node App
Step 9: After clicking the “Take snapshot”:
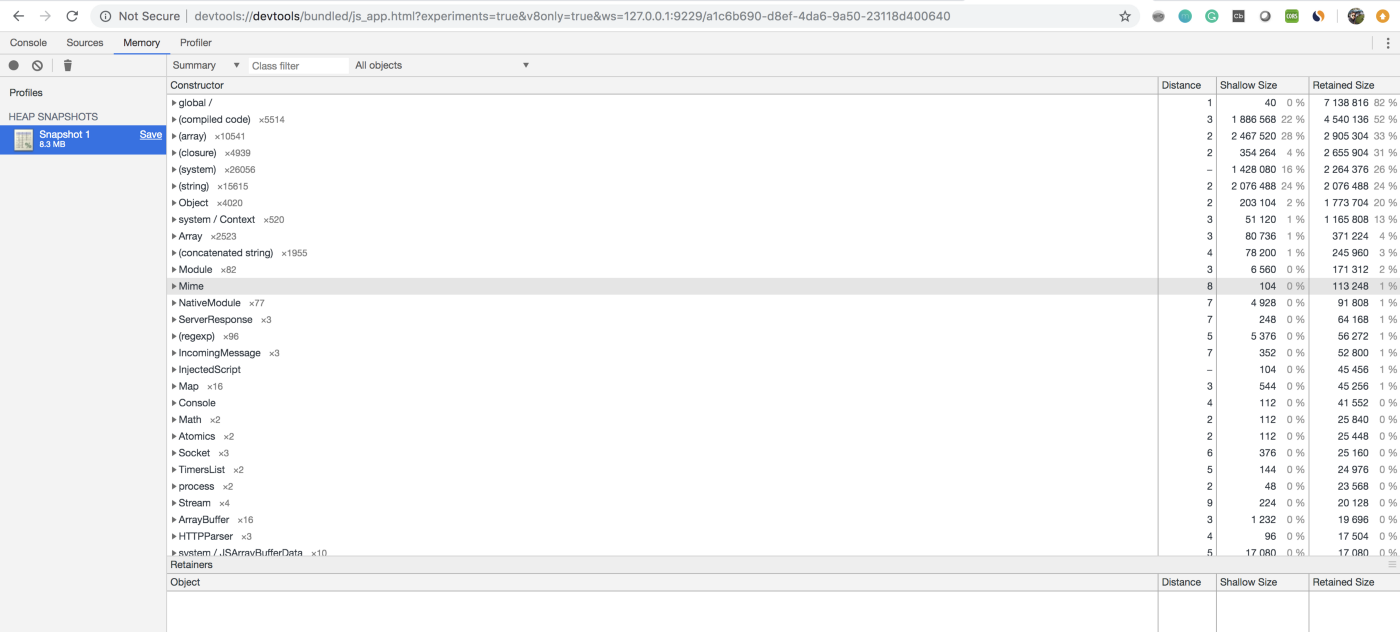
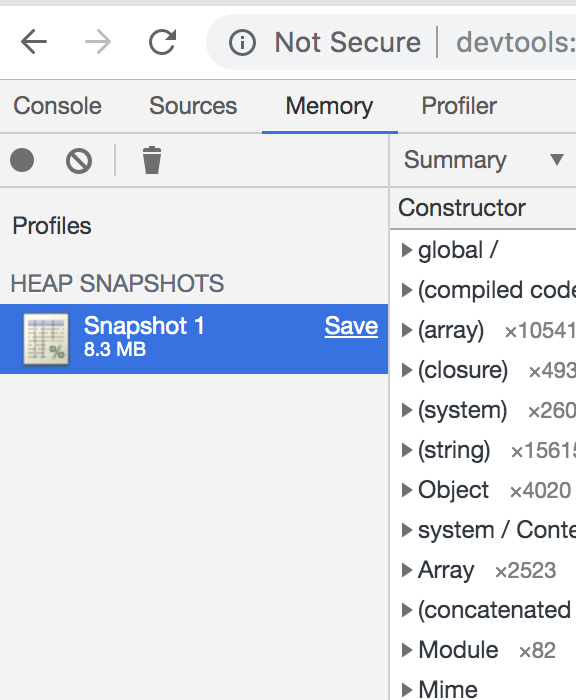
After clicking the “Take snapshot”, you can see there is a snapshot taken under the “profiles-> HEAP SNAPSHOT”. Now click on that “snapshot 1".
Profiling Node App
Profiling Node App
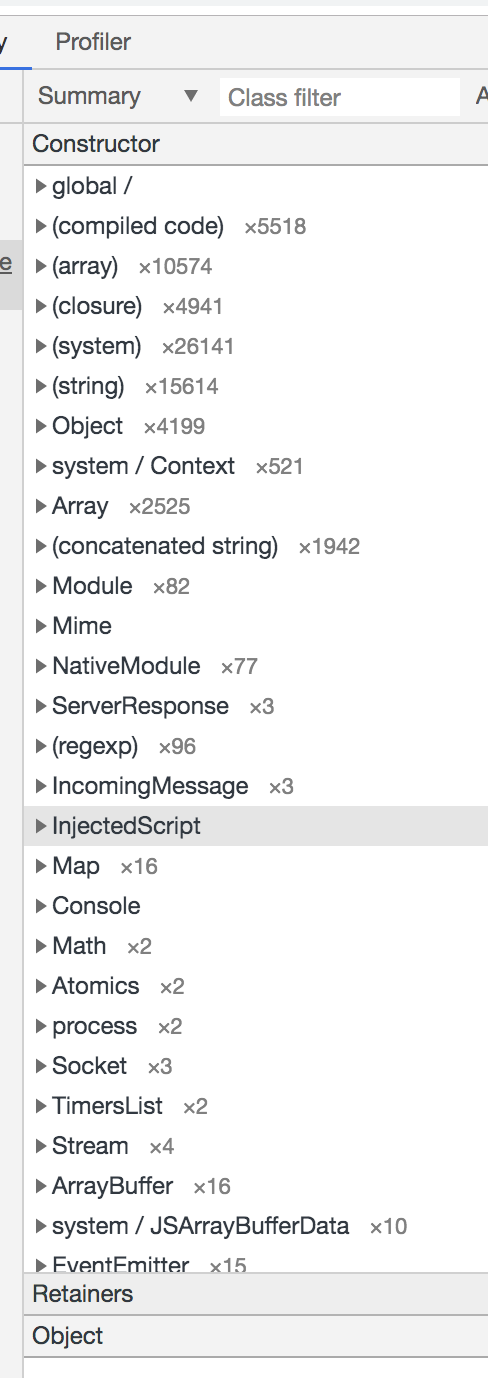
Step 10: After clicking on that “Snapshot 1”, You can see that each and every object created for this app.
* You can also see the num of that variable which is created to run this app.
Profiling Node App
* You can see how much memory is being used for this app.
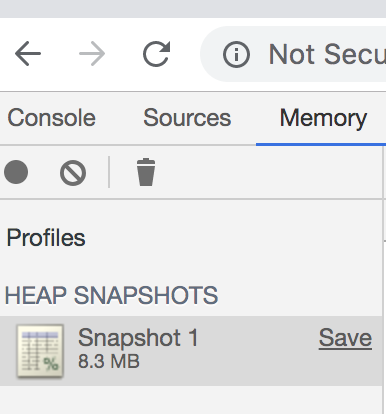
Profiling Node App
You can see in the above snapshot, the app is consuming total of 8.3 MB memory.
* You can see the “Shallow size” of that kind of variables.
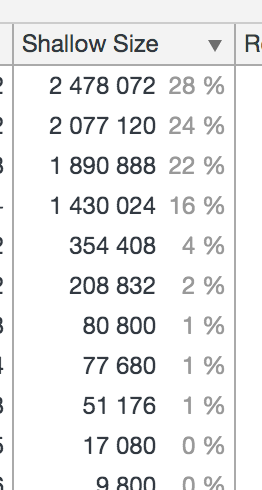
Profiling Node App
* You can see the “Retained Size” of that kind of variables.
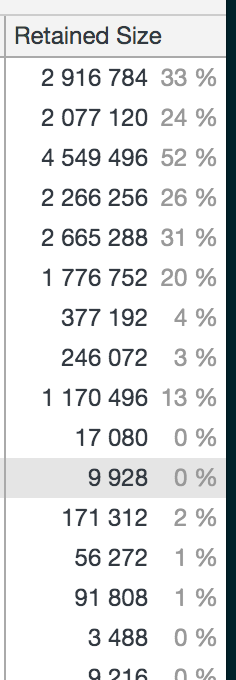
Profiling Node App
You can take multiple snapshots and compare each and everything by clicking on the left button as shown in the below snapshot:

Profiling Node App
The best use of it (Profiling Node App):
You can take snapshots before hitting an API and after hitting “N” API, Now you can compare the differences between. You can check where you need to improve. In the next blog, I will tell you how you can detect the memory leaks in your node app and how you can get the execution time of each function in your node app, also I will tell you how you can create the “flame chart” for your node app.
Congratulations… You are becoming an expert in node.js
Support our IDKBlogs team
Creating quality content takes time and resources, and we are committed to providing value to our
readers.
If you find my articles helpful or informative, please consider supporting us financially.
Any amount (10, 20, 50, 100, ....), no matter how small, will help us continue to produce
high-quality content.
Thank you for your support!
Thank you
I appreciate you taking the time to read this article. The more that you read, the more things you will know. The more that you learn, the more places you'll go.
If you’re interested in Node.js or JavaScript this link will help you a lot.
If you found this article is helpful, then please share this article's link to your friends to whom this is required, you can share this to your technical social media groups also.
You can follow us on our social media page for more updates and latest article updates.
To read more about the technologies, Please
subscribe us, You'll get the monthly newsletter having all the published
article of the last month.


